Introduction
Vancouver, a bustling west coast seaport, is full of business opportunities. Millions of tourists visit the city each year to enjoy its beautiful scenery, vibrant culture, and diverse culinary scene. As a result, Vancouver presents many possibilities for entrepreneurs who want to open their own restaurants.
However, choosing the right location is one of the biggest challenges. Potential restaurant owners must consider several factors:
- level of competition
- pedestrian traffic
- surrounding amenities and resources
This project aims to address this question by segmenting neighborhoods in Vancouver using clustering techniques. By analyzing venue data across neighborhoods, the project identifies patterns that may help investors determine promising locations for new restaurants.
Data
The neighborhood dataset is scraped from
Wikipedia – List of neighbourhoods in Vancouver.
Additional data sources include:
-
Geocoder — used to obtain geographic coordinates of each neighborhood
https://geocoder.readthedocs.io/ -
Foursquare API — used to collect venue data within each neighborhood
https://developer.foursquare.com/
The final dataset contains:
- 20 official Vancouver neighborhoods
- 510 venues
These venues serve as the primary features for neighborhood comparison.
Methods
Several techniques were applied for data acquisition, preprocessing, and model development using Python.
Data Acquisition
The list of official neighborhoods was scraped from
Wikipedia
using the BeautifulSoup and Requests Python libraries.
The geographic coordinates of each neighborhood were obtained using
Geocoder.
Venue information for each neighborhood was collected using the
Foursquare API, which returns venue names, categories, and coordinates.
Data Preprocessing
Venue categories represent a categorical feature, which was converted into numeric features using one-hot encoding.
For each neighborhood:
- the frequency of each venue category was calculated
- the top 10 most common venue categories were identified
These frequency vectors served as the feature set for clustering.
Model Development
An unsupervised machine learning algorithm — K-Means clustering — was applied to group similar neighborhoods.
The optimal number of clusters was determined using the elbow method.
Finally, Folium was used to visualize the clustering results on an interactive map of Vancouver.
Results
The full analysis and interactive visualization can be viewed here:
👉 View the Interactive Notebook
Exploratory Data Analysis
Figure 1 shows the number of venues in each neighborhood, while Figure 2 displays the relative frequency of the top 10 most common venue categories.
Downtown contains the largest number of venues, whereas Killarney has the fewest.
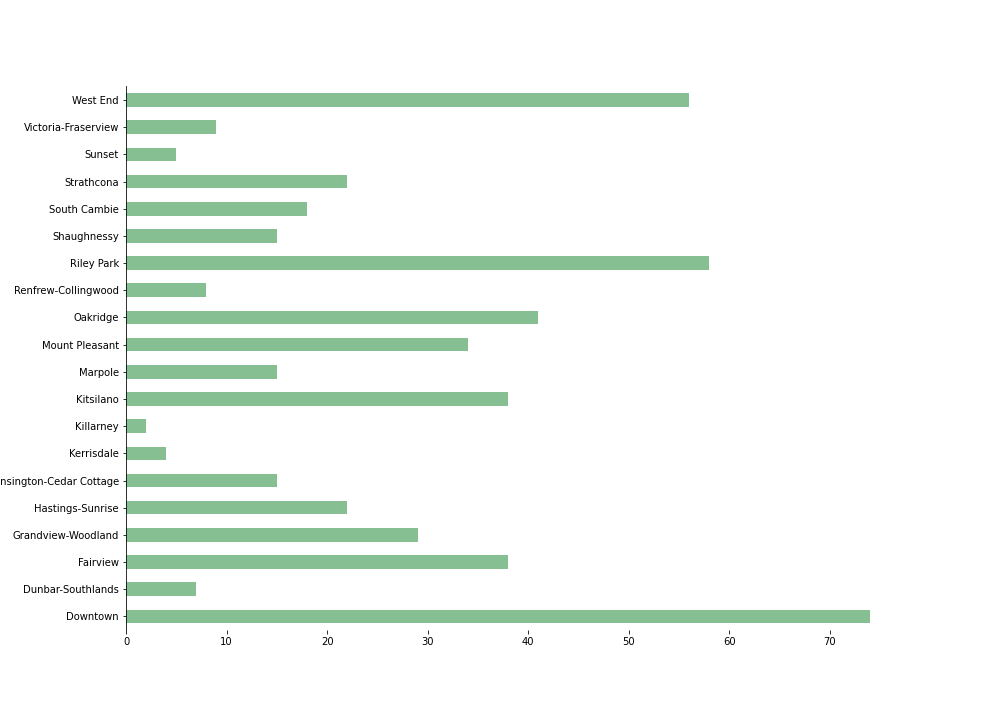
Figure 1. Number of venues in each Vancouver neighborhood.
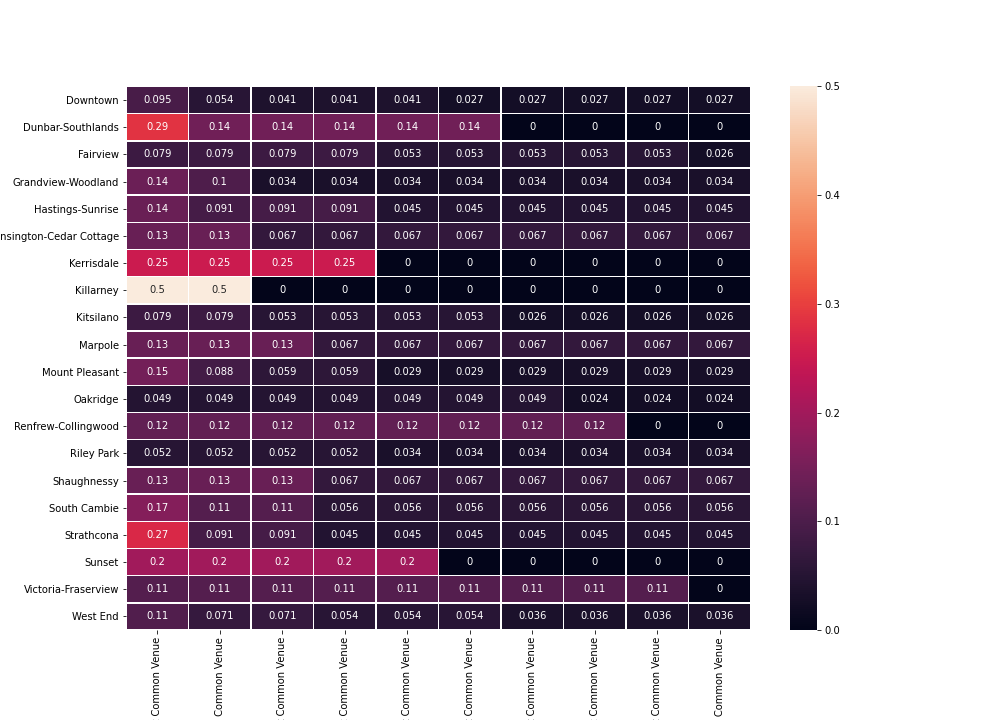
Figure 2. Frequency of the top 10 venue categories across neighborhoods.
Clustering
Using the elbow plot (Figure 3), the optimal number of clusters was determined to be 5.
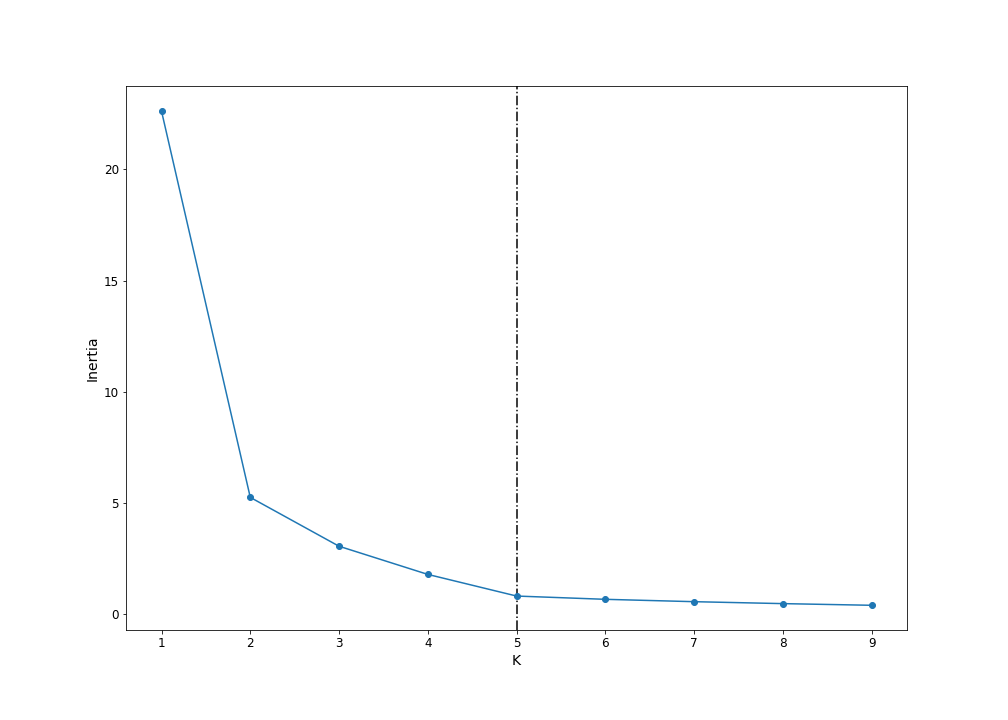
Figure 3. Elbow plot for determining the optimal number of clusters.
Discussion
Cluster analysis reveals distinct patterns in restaurant distribution across Vancouver neighborhoods.
- Cluster 1 (purple) and Cluster 2 (blue) contain the highest concentration of restaurants.
- Japanese and Chinese restaurants are mostly found in Cluster 1.
- French restaurants are more common in Cluster 2.
Cluster 1 includes Downtown Vancouver, which experiences high pedestrian traffic but also intense competition and higher rent costs.
Cluster 2 neighborhoods are slightly farther from downtown, offering potentially lower rent and less competition.
Cluster 3 contains a large number of cafés and coffee shops, suggesting strong potential for dessert or specialty café businesses.
Therefore:
- Investors with larger budgets may prefer neighborhoods close to downtown such as Downtown, South Cambie, and Oakridge.
- Investors seeking lower costs and less competition may consider neighborhoods farther from downtown within Clusters 2 or 3.
Interactive Map
Figure 4. Neighborhood segmentation results visualized on an interactive map
Conclusion
This project applied K-Means clustering to successfully segment 20 Vancouver neighborhoods into 5 clusters.
The analysis provides insights into:
- restaurant distribution patterns
- neighborhood characteristics
- potential opportunities for restaurant investors
Future improvements could incorporate additional data sources such as:
- population density
- neighborhood income levels
- tourism data
- commercial rental prices
These additional features could further improve the accuracy of neighborhood segmentation and business recommendations.